Skip to content
Gold, oil & silver: 2026 price predictions and odds
Skip to content
Scanner
News
LIVEEconomy & Finance· June 1, 2026

Gold, oil & silver: 2026 price predictions and odds

Updated just now
Gold, oil & silver: 2026 price predictions and odds

Key Highlights

  • Any gold price forecast for 2026 starts with structurally tight supply: central banks bought 863 tonnes in 2025, still double the pre-2022 pace, and silver faces a sixth straight annual deficit as solar manufacturing alone consumes over 25% of mine output.
  • Oil predictions hinge on the Strait of Hormuz, through which roughly 20% of global oil transits. The strait has been effectively closed since late February 2026; a conditional US-Iran ceasefire eased the worst-case premium in May and pulled WTI back toward the high $80s.
  • Polymarket and Kalshi price live odds on every threshold: where gold, oil, and silver settle, and which of gold, Bitcoin, or the S&P 500 leads in 2026, with resolution dates at both mid-year (June 2026) and year-end horizons.
Gold, oil, and silver are three of the most-watched price predictions of 2026, and the forces moving them are linked. Gold tracks four drivers: real rates, the dollar, central bank buying, and risk sentiment. Silver adds industrial demand on top of that monetary bid. Oil swings on OPEC+ policy, US shale, and the geopolitical premium tied to Middle Eastern chokepoints. The reference tables below carry the supply and demand detail behind each.

What will move 2026 commodity prices

These are the variables that drive any 2026 gold price forecast, plus the oil and silver predictions alongside them. For more across the sector, see economy and finance prediction markets.
  • Whether central bank gold buying reaccelerates toward the 1,000+ tonne annual pace of 2022 to 2024 or holds near the moderated 2025 level, when purchases came in at 863 tonnes as higher prices mechanically reduced the tonnage needed to hit reserve allocation targets
  • Whether the Strait of Hormuz reopens to normal traffic: a conditional US-Iran ceasefire eased the worst-case oil premium in May, but the strait still runs near 5% of its pre-crisis vessel count, so any breakdown reprices oil fast
  • Whether solar manufacturers accelerate substitution toward copper and silver-free panel designs now that silver represents a materially larger share of panel production costs than its historical average
  • The Federal Reserve's rate path, which influences all three metals and oil: whether the Fed holds, cuts, or hikes in response to Iran-driven inflation pressure will reprice every non-yielding hard asset on this page
  • OPEC+ production policy: the cartel added 206,000 bpd in April and a further 188,000 bpd in May, and now meets monthly, so each decision signals whether it defends price or keeps unwinding cuts

How prediction markets price the 2026 outlook

Threshold vs. Settlement Markets: Gold and oil prediction markets on Polymarket come in two formats: threshold contracts (will gold hit $X by date Y?) and settlement brackets (what range will gold close in?). The bracket markets show the full probability distribution behind a gold price forecast, while thresholds let traders express directional conviction at specific levels.

Year-End vs. Mid-Year Resolution: Markets on this page resolve across two time horizons. June 2026 contracts on Polymarket capture medium-term positioning for gold, oil, and silver, while December 2026 and year-end markets on both Polymarket and Kalshi reflect the full-year outlook. Comparing pricing across horizons reveals how the market discounts time and uncertainty.

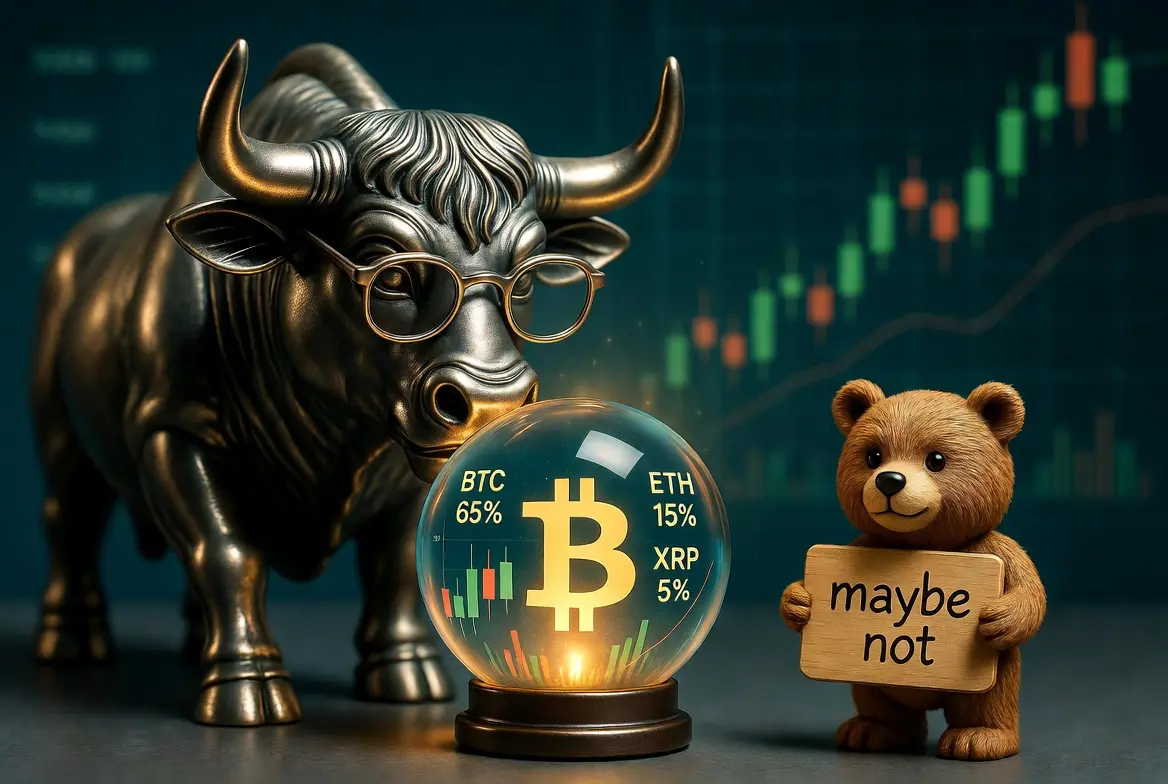
The Gold vs. Everything Trade: A three-way performance market on Polymarket pits gold against Bitcoin and the S&P 500 for best 2026 return, while a companion binary contract on Kalshi isolates the Bitcoin vs. gold question. Together, they capture how traders weigh the safe-haven bid against risk assets in a year dominated by geopolitical disruption and monetary policy uncertainty.

Oil's Geopolitical Premium: Crude oil threshold markets on both Polymarket and Kalshi turn the 2026 oil price prediction into live odds on supply-disruption risk, with Kalshi offering year-end WTI maximum-price contracts that capture tail scenarios up to $180 per barrel.

Total Volume
Active Markets
Platforms

Key Indicators

Gold YTD-
WTI Crude
Brent Crude
VIX.
10Y Treasury
S&P YTD+
USD Index YTD+

Commodity Timeline

Oct 2025
Gold breaks $4,000/oz for first time
Impact: Confirmed structural bull market; triggered institutional reallocation
Oct 2025
Silver surpasses $50/oz for the first time since 1980
Impact: Broke 40+ year resistance level; triggered momentum buying and analyst upgrades
Jan 28, 2026
Gold hits all-time high of $5,589/oz
Impact: Peak driven by tariff and Greenland fears; sharp pullback to the mid-$4,000s followed
Jan 29, 2026
Silver hits all-time high of $121.64/oz
Impact: First-ever breach of $100 and $120; CME margin hike triggered a correction back toward $70-$80
Feb 28
U.S.-Israeli air war on Iran begins
Impact: Oil surged 8%+ in one session; Hormuz shipping disrupted within days
Mar 1
OPEC+ agrees to add 206,000 bpd starting April
Impact: Pre-conflict decision; limited offset vs Hormuz shut-in of 10+ mb/d
Mar 4
Iran declares Strait of Hormuz closed
Impact: Shipping traffic drops to near zero; largest supply disruption in oil market history
Mar 11
IEA releases 400 mb from emergency reserves
Impact: Signals severity of disruption; intended to bridge temporary gap
Apr 5
OPEC+ confirms 206,000 bpd April hike
Impact: Cartel begins unwinding cuts; shift to monthly review meetings
May 3
OPEC+ adds a further 188,000 bpd
Impact: Second monthly increase; supply response to the Hormuz disruption
Late May
Preliminary US-Iran ceasefire on Hormuz
Impact: WTI fell ~17% on the month toward the high $80s as the worst-case premium eased; strait still near 5% of normal traffic
Jun 30
June commodity threshold markets resolve
Impact: Gold, oil, and silver June bracket and threshold markets all settle
Dec 31
Year-end markets resolve
Impact: Gold Dec thresholds, WTI max, BTC vs Gold, asset performance settle

Commodity snapshot (as of June 1, 2026)

Externally sourced spot levels and records that frame the live markets above. Refreshed on our weekly cadence; live market-implied odds render at the top of the page.
MetricLevelNote
Gold spot~$4,580/ozLate-May 2026; down from the Jan 28 record as the Middle East premium lifted rate-hike fears
Gold all-time high$5,589/ozSet Jan 28, 2026 (intraday); the reference point for the Dec threshold markets
Silver spot~$76/ozLate May 2026; well below the January peak but far above the pre-2025 range
Silver all-time high$121.64/ozSet Jan 29, 2026; first move above the 1980 record of $49.95
WTI crude spot~$87-89/bblLate May 2026; fell ~17% on the month on the preliminary US-Iran ceasefire
Brent premium to WTIBrent ~$100-130 risk bandAnalyst range cited if the Hormuz disruption persists; Brent led the spike
Central bank gold buying863 tonnes (2025)WGC full-year; Poland the largest buyer; still ~2x the 2010-2021 average
Hormuz vessel traffic~5% of normalRoughly 150 tankers anchored offshore; pre-crisis ran ~3,000 vessels/month

Commodity Fundamentals

IndicatorValueContext
Global Gold Ever Mined~220,000 tonnesWGC end-2024 estimate: 219,890t; grows ~1.5% per year via mine output
Gold Mine Production Cost~$1,500-$1,600/oz (AISC)Global average all-in sustaining cost rose 6% in 2025; S&P projects 5% decline in 2026
Annual Gold Mine Output~3,700 tonnes/yearRecord 3,672t in 2025 per WGC; major new deposits increasingly rare
Top Gold ProducersChina, Russia, AustraliaTogether produce ~30% of global mine supply; geopolitical risk embedded in top 3
Central Bank Gold Reserves~36,200 tonnes globally2022-2024 saw 1,000+ tonnes of annual net purchases; 2025 moderated to 863t but still double the pre-2022 average
Strait of Hormuz Oil Flow~20% of global supply~20 million bbl/day pre-crisis; connects Persian Gulf to open ocean
Global Proved Oil Reserves~1.75 trillion barrels~47 years at current consumption; OPEC holds ~70%
Silver Industrial Share~60% of annual demandSolar PV alone consumes 25%+; far higher industrial ratio than gold (~5%)
Annual Silver Mine Output~25,500 tonnes/year819.7 Moz in 2024; 70% is byproduct of lead, zinc, copper, and gold mining
OPEC+ Spare Capacity~3.5 million bpd (pre-crisis)Concentrated in Saudi Arabia and UAE; ability to export limited while Hormuz closed

What Drives Gold Prices

The key forces that have explained the majority of gold's quarterly price movements over the past two decades.
DriverMechanismCurrent Regime
Real interest ratesLower real yields reduce the opportunity cost of holding non-yielding goldFed holding rates steady; rate cuts pushed to late 2026 at earliest due to Iran-driven inflation
U.S. dollar strengthWeaker dollar makes gold cheaper globally and signals reserve diversificationDollar under pressure from fiscal concerns and de-dollarization; central banks shifting reserves to gold
Central bank buyingDirect physical demand that is price-insensitive and persistent2025 saw 863t of net purchases (below 1,000+ in 2022-24 but still double pre-2022 average); Poland led with 102t
Risk/uncertaintyGeopolitical stress and financial market volatility drive safe-haven flowsElevated: Iran conflict, Hormuz closure, tariff policy, fiscal sustainability concerns
Momentum/positioningETF flows, futures positioning, and retail participation amplify movesGold ETFs saw a record ~$89B of inflows in 2025; managed money long positioning remains elevated

Gold Supply Fundamentals

What a trader needs to know about where gold comes from and why supply cannot easily respond to price.
FactorValueWhy It Matters for Trading
All-in sustaining cost (AISC)~$1,500-$1,600/ozGlobal average rose to $1,521 in 2025; S&P projects record margins of ~$2,800/oz in 2026
Mine-to-production timeline10-20 yearsNew discoveries take a decade+ to reach production; supply is inelastic
Annual mine output~3,700 tonnesHit record 3,672t in 2025 per WGC despite gold tripling in price over prior years
Recycling share of supply~25-28%Rises when prices spike, but muted recently (gold-as-collateral trend in India)
Top 3 producersChina, Russia, AustraliaGeopolitical risk embedded in supply chain; sanctions on Russia add friction
Above-ground stock~220,000 tonnesUnlike oil, gold is never consumed; virtually all ever mined still exists
Central bank share~17% of above-ground stockShifted from net sellers (1990s-2000s) to aggressive net buyers post-2022; 863t added in 2025

Oil Market Structure

The mechanics that determine whether oil spikes or collapses.
FactorValueWhy It Matters for Trading
Global consumption~104 million bpdGrows ~1% annually; transport is largest demand sector
OPEC+ market share~40% of global productionCartel pricing power; voluntary cuts vs market share strategy
OPEC+ spare capacity~3.5 million bpdPre-crisis estimate; mostly Saudi Arabia and UAE; export routes constrained while Hormuz closed
U.S. crude production~13.5 million bpdEIA projects ~13.5 mb/d of total US crude in 2026, down from 13.6 in 2025; shale is ~11 mb/d and responds to price within 6-12 months
Strategic reserves (global)~8,200 million barrelsIEA released record 400 mb in March 2026; designed to bridge temporary disruptions
Strait of Hormuz throughput~20 million bpd (pre-crisis)Single chokepoint for Persian Gulf exports; effectively closed since late February 2026, running near 5% of normal vessel traffic
Breakeven for U.S. shale~$50-65/bblFloor below which U.S. production declines; Permian is lowest cost

Silver's Dual Identity

Why silver behaves like both a precious metal and an industrial commodity.
FactorValueWhy It Matters for Trading
Industrial demand share~60% of annual consumptionFar higher than gold (~5%); makes silver sensitive to economic growth
Solar PV consumption25%+ of annual supplyLargest single industrial use; structural growth tied to energy transition
Byproduct mining~70% of silver outputSupply does not respond directly to silver price signals
Annual supply deficit6th consecutive year (2026)Silver Institute projects 67 Moz deficit in 2026; draws down above-ground inventories
Substitution thresholdSilver at >30% of panel costManufacturers actively developing copper and silver-free alternatives
Gold/silver ratio (historical)Long-term avg ~55-65:1Ratio above 80 signals silver undervalued; below 50 signals overvalued
Above-ground investment stockMuch smaller than goldSilver market ~1/10th size of gold; more volatile in both directions

All related markets

events · markets · Updated just now
POLY
Gold markets
What will Gold (GC) hit__ by end of December?
Gold hit HIGH y Dec-
POLY
Gold markets
What will Gold (GC) settle at in June?
Gold settle -+
POLY
Gold marketsRESOLVED
What will Gold (GC) hit__ by end of June?
Gold hit HIGH June
KLSH
Crude Oil markets
How high will WTI oil get by Dec, ?
WTI reach y Dec
POLY
Crude Oil markets
Will Crude Oil (CL) hit__ by end of June?
Oil hit HIGH June
POLY
Silver markets
Will Silver (SI) hit__ by end of June?
Silver hit HIGH June
POLY
Silver markets
What will Silver (SI) settle at in June?
Silver settle --
POLY
Cross-Asset Performance markets
Bitcoin vs. Gold vs. S&P in
S&P best performance
KLSH
Cross-Asset Performance
Will Bitcoin outperform gold in ?
BTC outperform gold -
Ben L.
Ben L.

Founder & CEO

Former gaming executive, multiple-time founder, and public and private market investor. Brings the operator perspective most sites can't: why platforms make the decisions they do, and what that means for you.

More news

More in Economy & Finance.

SpaceX IPO: odds, predictions, and valuation
Economy & Finance

SpaceX IPO Odds 2026: Valuation Prediction Markets

SpaceX IPO, Starship launch milestones, and Artemis moon mission prediction market contracts on Polymarket and Kalshi.

AI IPOs (OpenAI, Anthropic, SpaceX): valuations and odds
Economy & Finance

AI IPOs (OpenAI, Anthropic, SpaceX): Valuations & Odds

AI IPO timing, valuation brackets, model supremacy, and market cap prediction market odds on Polymarket and Kalshi.

Bitcoin price prediction 2026: live odds and crypto forecasts
Economy & Finance

Bitcoin Price Prediction 2026: Odds & Forecasts

BTC price thresholds, altcoin returns, crypto regulation, and institutional stress contracts on Polymarket and Kalshi.

Recession odds and 2026 housing market predictions
Economy & Finance

Recession Odds & 2026 Housing Market Predictions

Recession, Fed rate cuts, inflation, and housing policy prediction market odds across Polymarket and Kalshi.

What should we be tracking for you? Set up alerts free in 30 seconds.

Last updated